3 Sankey Diagrams You Can Make From Your Own Data
▶ Read as storyYou commented DIAGRAM, so here are the diagrams. A Sankey diagram shows where everything flows: people, clicks, money. The thicker the band, the more goes that way. One look tells you where you win and where you leak.
Why this chart
Building with AI means a lot of things at once
When you build with AI you ship fast: a site, a tool, a launch, a newsletter. Soon the numbers sit in ten different tabs, analytics here, payments there, signups somewhere else, and nothing connects. A Sankey puts it on one picture. You see every step, and the leak jumps out at you.
It is also the best chart to hand to your AI agent. The data behind it is just a list of rows, from → to → number, so your agent can read it, check it and suggest what to fix first.
Example 1: your comment to DM funnel
Real numbers from my own reel
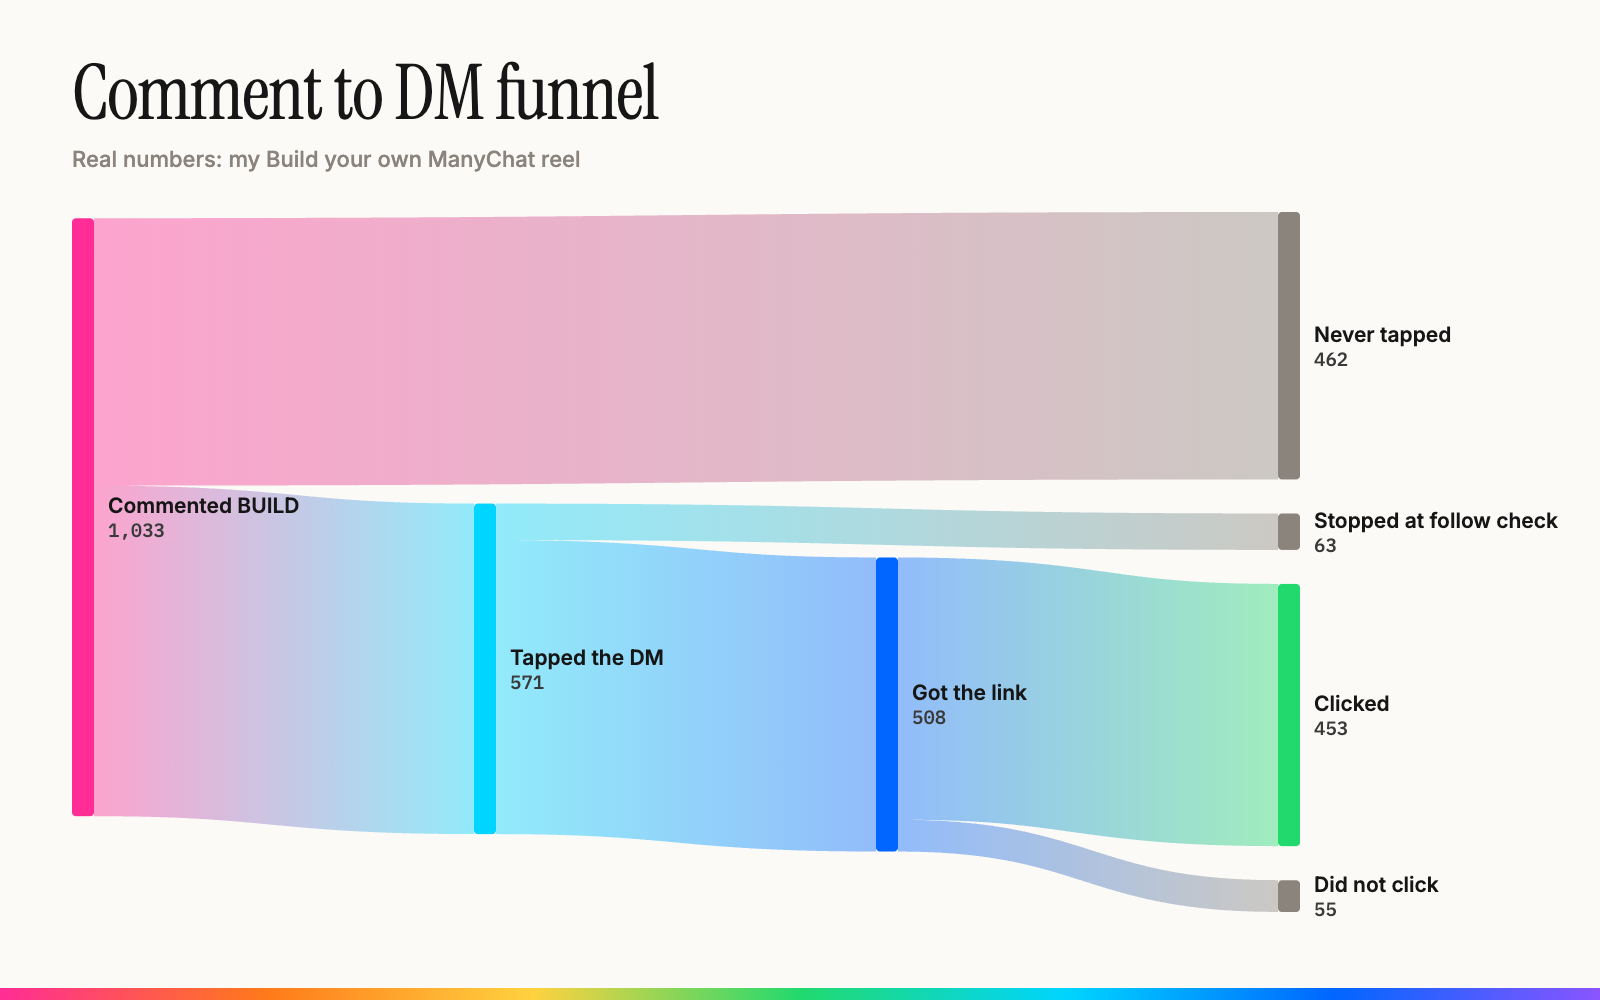
This is my Build your own ManyChat reel. 1,033 people commented, 571 tapped the DM, 508 got the link and 453 clicked it. The big gray band at the top is the leak: 462 people commented and never tapped the message. That is the first thing I would test, not the link page.
Example 2: where your visitors come from and go
Your website, one month
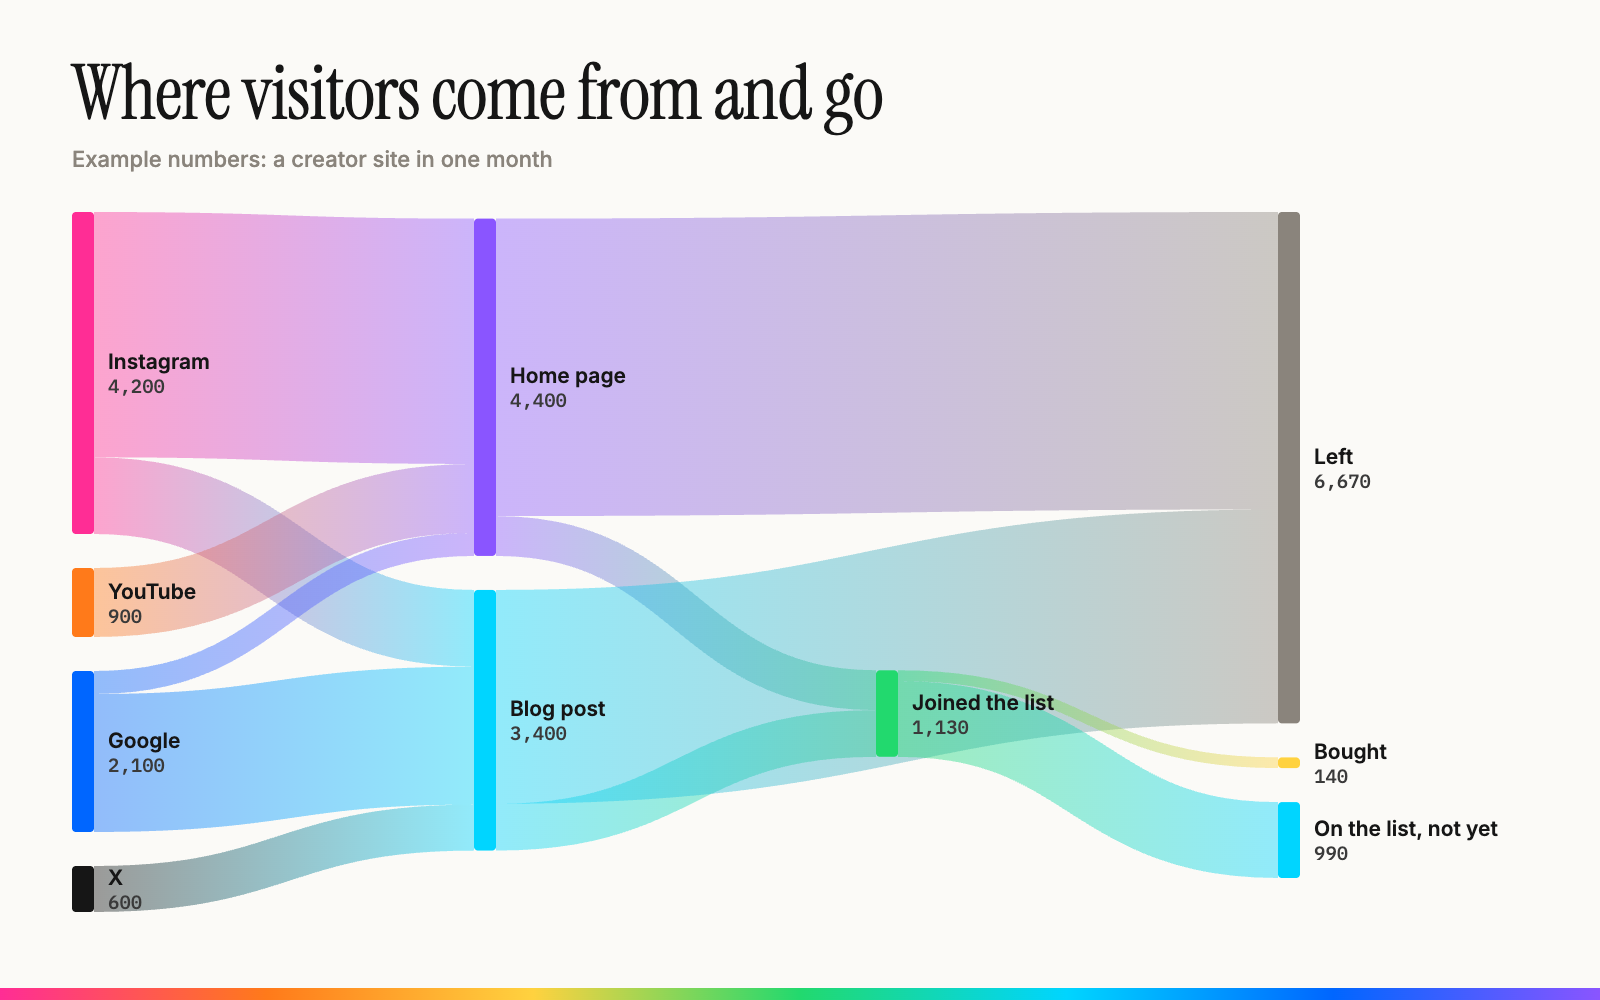
Sources on the left, pages in the middle, what people did on the right. You see which source actually turns into signups, not just visits. In this example Google sends half the visits Instagram does, but its readers land on the blog post, which converts better.
Example 3: where the money goes
Revenue in, costs out
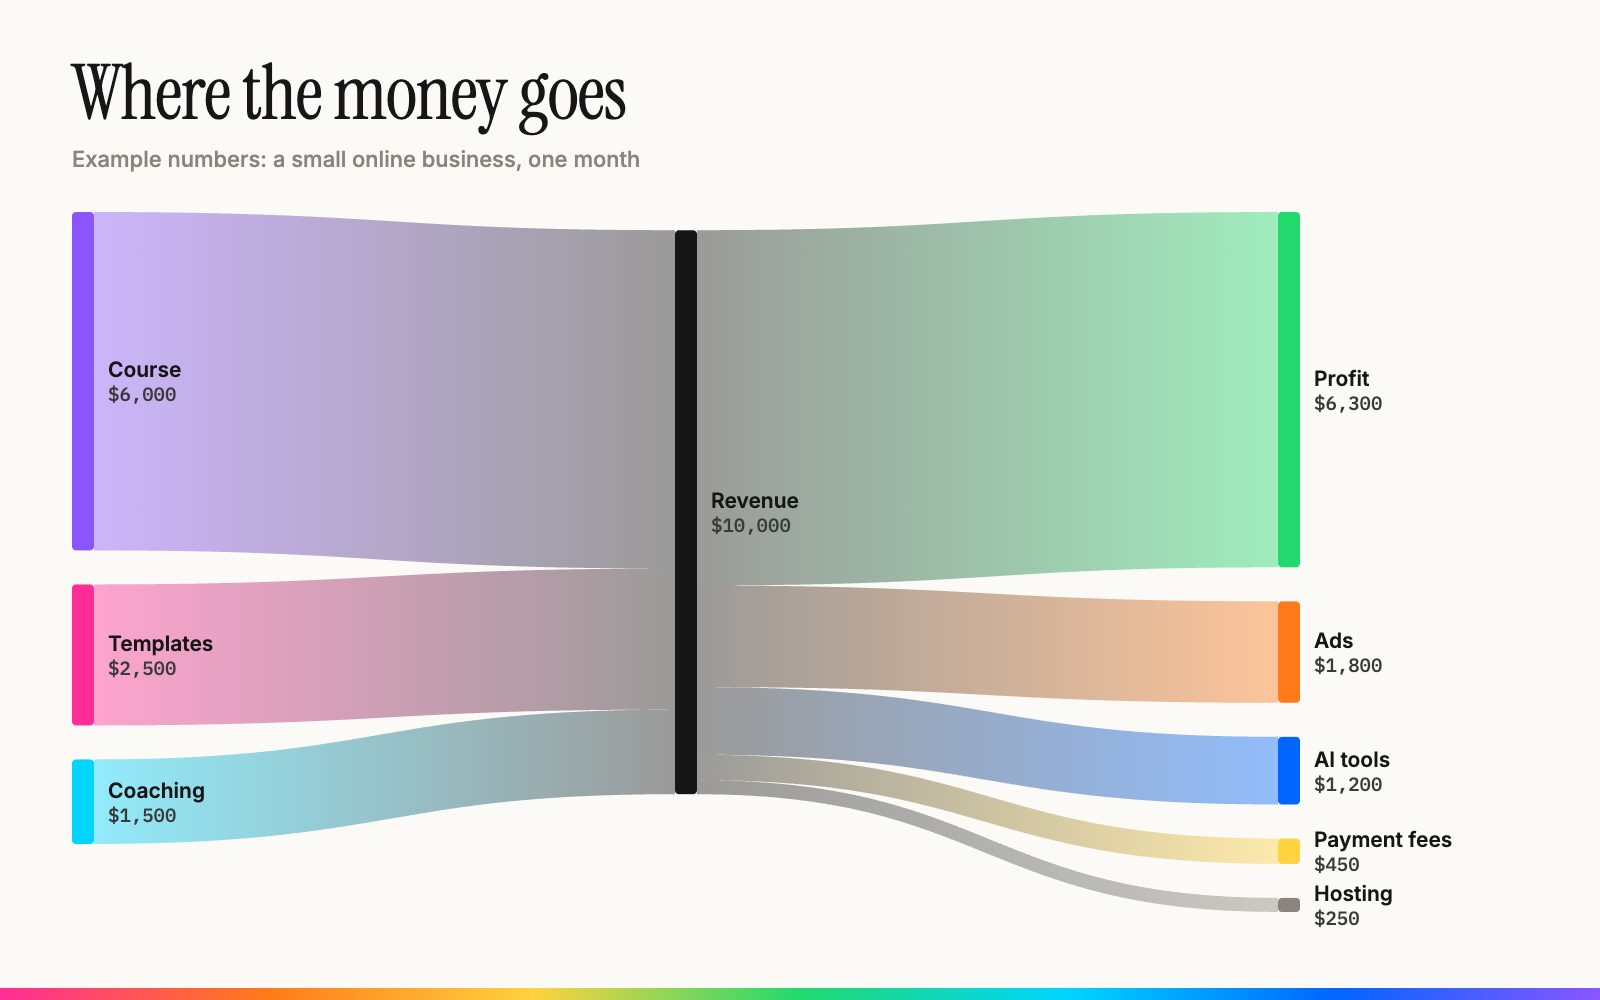
What you sell on the left, your costs and profit on the right. Every tool subscription and fee gets its own band, so the expensive ones are impossible to miss.
Examples 2 and 3 use example numbers. Swap in yours with the prompts below.
The prompts
Paste one into Claude Code, or give it to your AI of choice
Your funnel:
Make me a Sankey diagram of my funnel as one HTML page using d3-sankey.
My steps and numbers are: [paste them, e.g. commented 1,033 → tapped DM 571 → got link 508 → clicked 453].
Show the people who drop off at each step as a gray band, label every band with its number, and tell me which step loses the most people.
Your website traffic:
Turn my site's analytics into a Sankey diagram as one HTML page using d3-sankey.
Here is my data: [paste an export from your analytics, or connect to it].
Flow: traffic source → landing page → what they did (joined the list, bought, left).
Label every band with its number and tell me which source and page convert best.
Your money:
Make a Sankey diagram of my business money for [month] as one HTML page using d3-sankey.
Income: [product → amount, ...]. Costs: [tool or fee → amount, ...].
Flow: each product → revenue → each cost and profit. Show amounts on every band and list my three biggest costs.
The 3 steps
Ten minutes for the first one
1. Get your numbers. Export them from your analytics, payments or email tool, or just type them in. Rough numbers are fine for the first one.
2. Paste a prompt. Into Claude Code, Claude or ChatGPT. Never used Claude Code? Start here.
3. Ask it to keep it live. Once you like it, ask your AI to pull the numbers automatically every day and put the page on your own domain, so you and your agents can open it anywhere. Here is the setup I use.
Running a business? Tell me about it and I'll send back what I'd do with AI. Free.